
Point it at a spreadsheet or live database and get ranked charts, trends and a plain-language summary in seconds.
Data Analysis is MADXVISION's internal analytics engine — upload a CSV or connect a MySQL table, and it profiles every column, flags outliers and anomalies, and builds the charts that actually explain the data instead of a generic dump of every field. A natural-language box lets anyone ask a question in plain English and get back a chart plus a one-paragraph explanation. Reports export straight to PDF for client and internal reviews.
- Column profiling — type, range, nulls and outliers on upload
- Auto-picks the chart type that best explains each field
- Natural-language query box — ask in plain English
- Anomaly and trend flags surfaced automatically
- Direct MySQL connection alongside CSV upload
- One-click PDF report export
- Next.js
- MySQL
- Auto-charting
- Anomaly detection
- NL queries
- PDF export



 Commercial work
 AI Lana
 Driver Kurdi
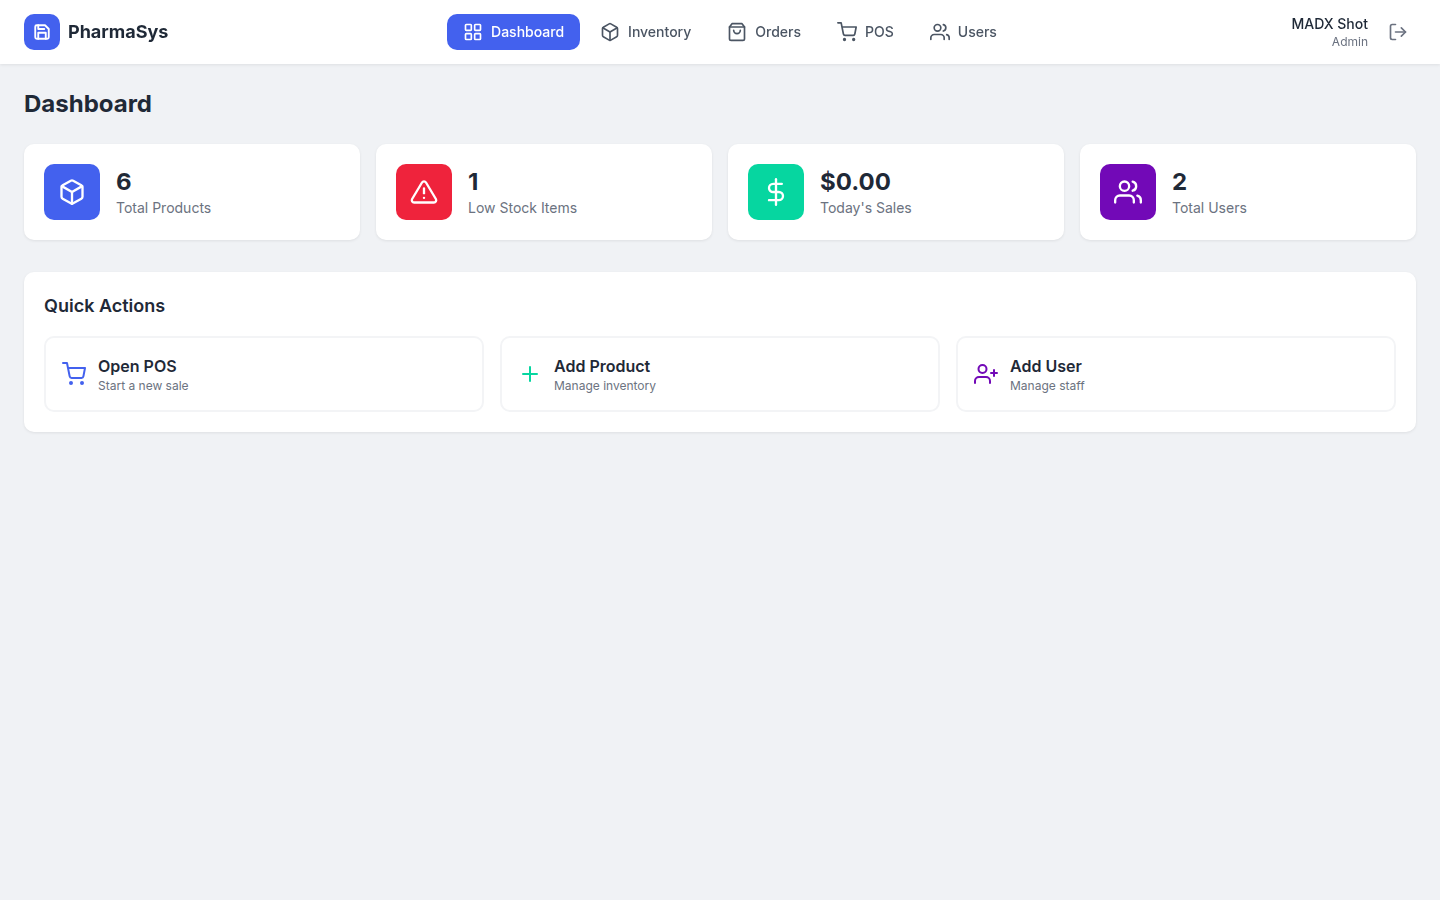 Inventory & Order ERP
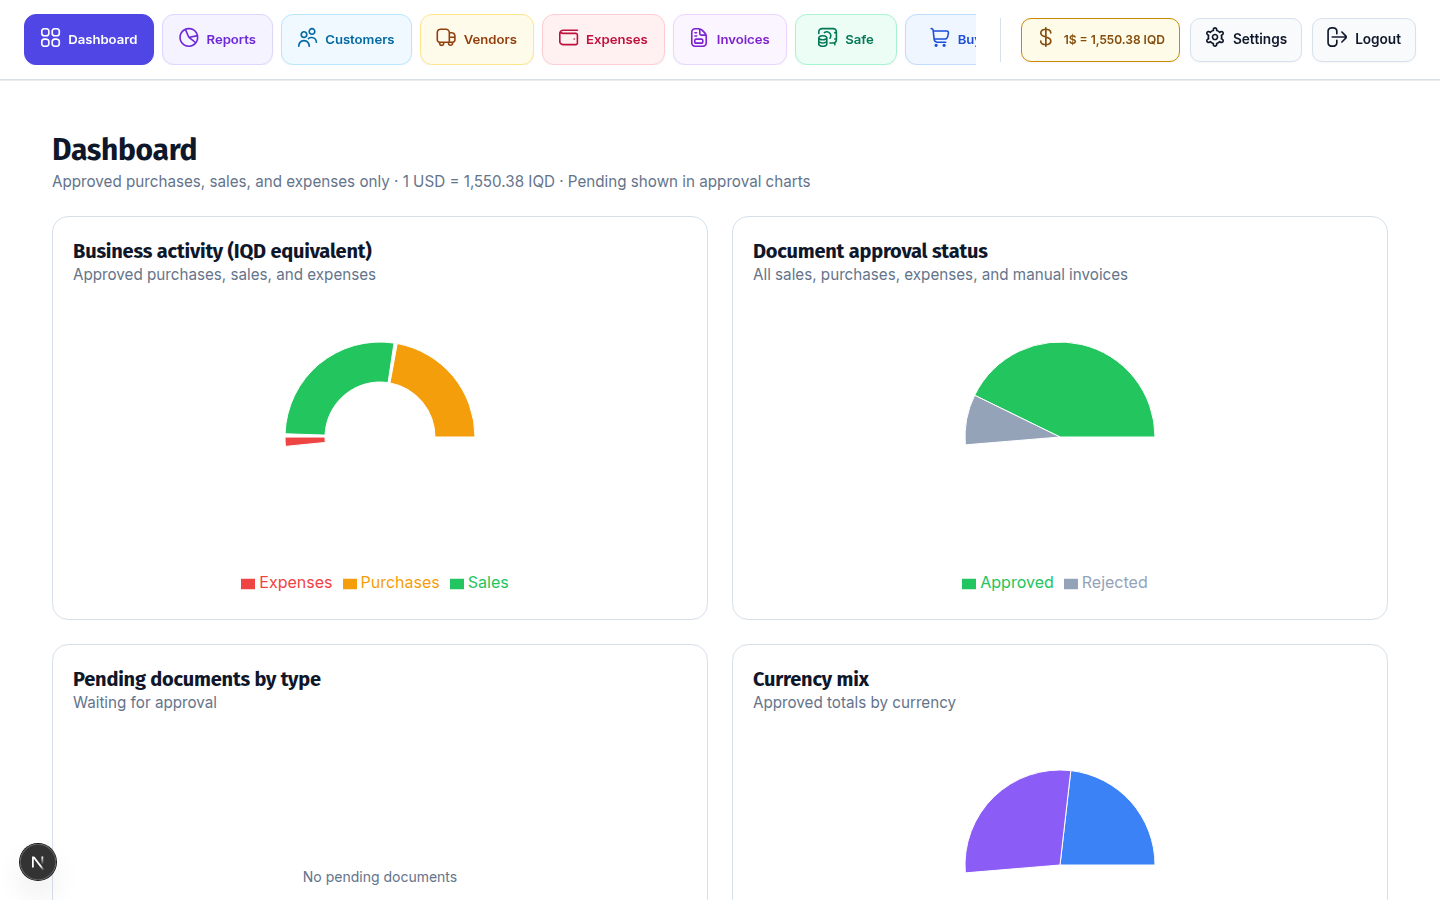 Hatem Accounting
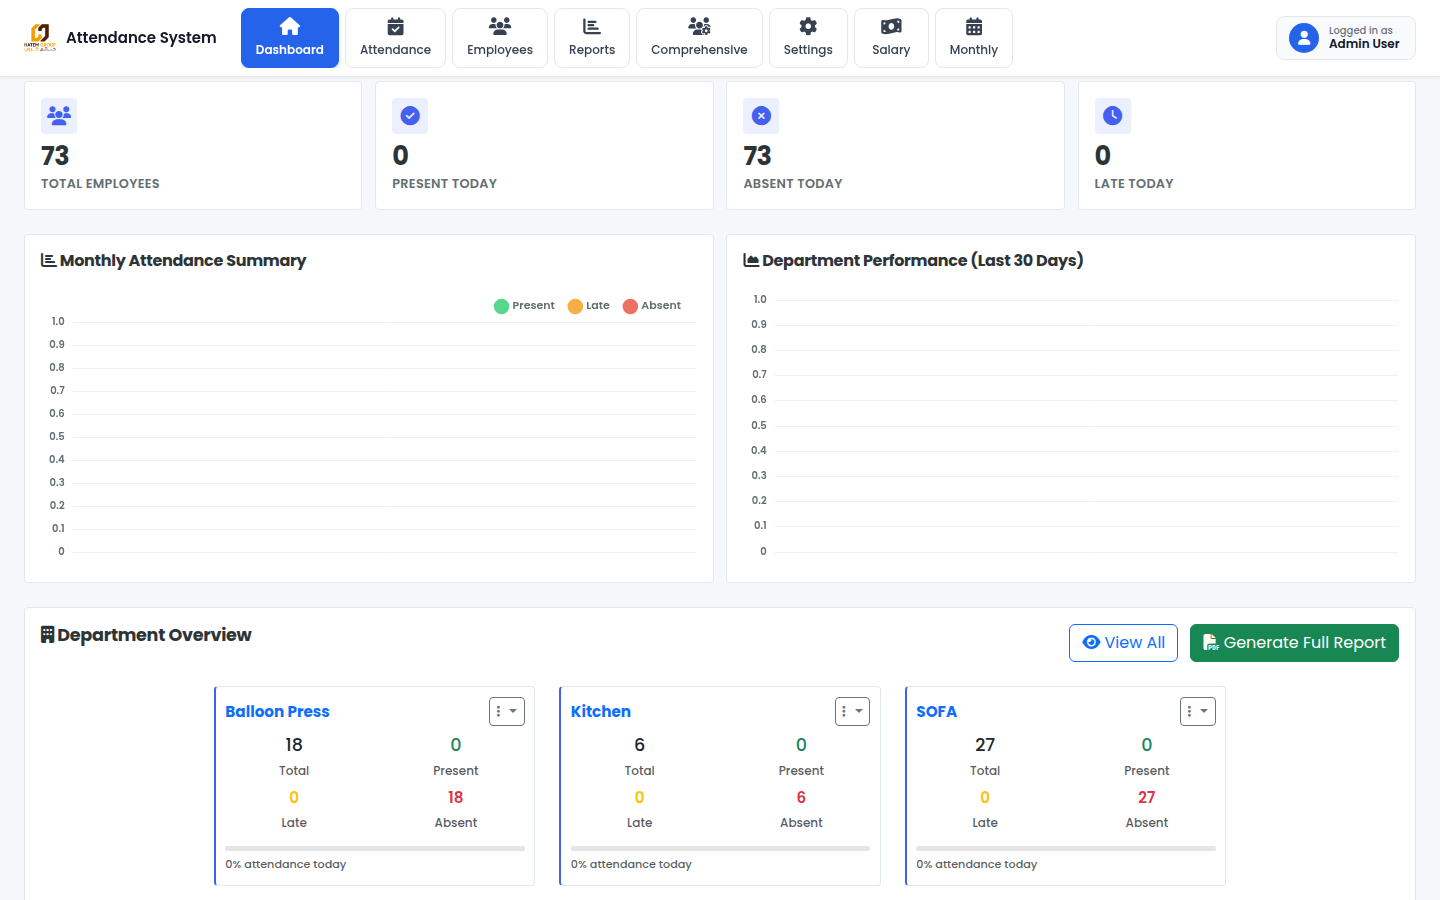 Hatem Group Attendance
 Hatem Factory Desk